Proprietary index data: ArdhiHome Kenya Property Market Index (Feb 2026) — 549 neighborhood × transaction combinations, Nairobi Metro, Mombasa Coast & Satellite Towns, sourced from. Macro data: Central Bank of Kenya (CBK), Kenya National Bureau of Statistics (KNBS), Business Daily Africa, The Kenyan Wallstreet.
The number most buyers never see: 24.9%.
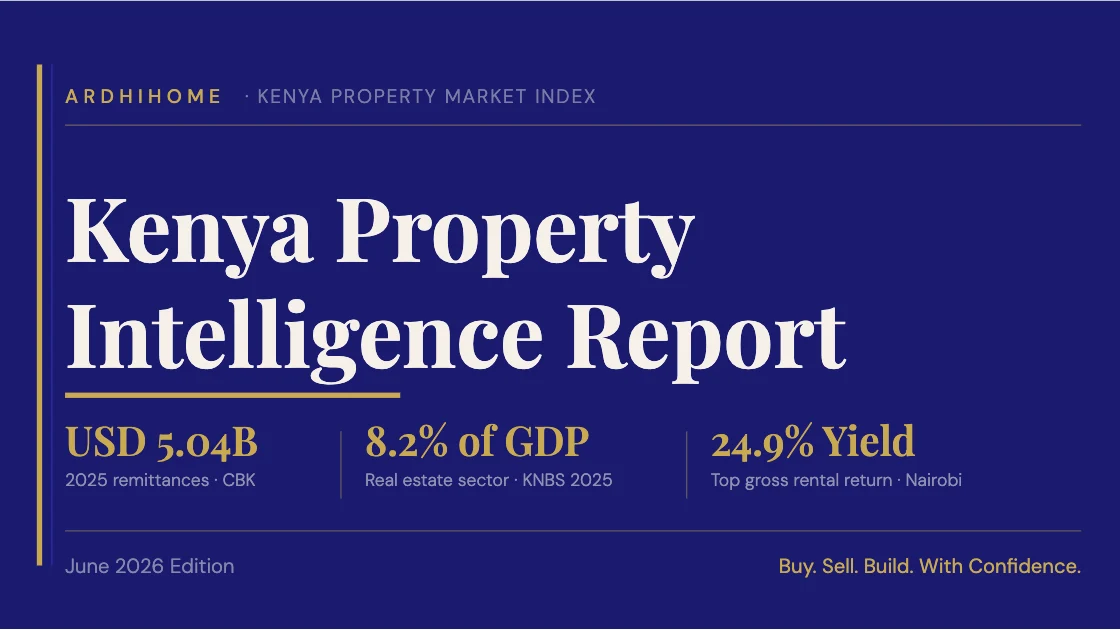
That's the gross rental yield in Wood Avenue, Nairobi. Median sale price: KSh 8.2 million. Median monthly rent: KSh 170,000. You buy once. It pays you back every month.
Five kilometers away in Karen, the same calculation returns 3.0%.
Both neighborhoods carry a "prime Nairobi" label. The difference in investment return is 8x. Almost nobody is talking about it — because there has never been a verified, publicly available dataset that makes this comparison possible. Until now.
Where the Market Is Moving
Kilimani is the most liquid real estate market in Kenya right now — 1,831 active sale listings with a median price of KSh 9 million. Westlands Area follows with 1,710 listings at a KSh 7 million median. Kileleshwa sits at 1,606 listings and KSh 8.5 million. Lavington rounds out the top four with 1,432 listings, also at a KSh 9 million median.
Those four neighborhoods alone carry over 6,500 active listings within a 5–10km radius of Nairobi's core.
What this tells you: the KSh 7–9 million price band is where supply is deepest and buyer competition is most intense. If you're buying in this range, you are in Kenya's most contested market. If you're selling here with a verified, well-presented listing, you have real pricing leverage — the buyers are already looking.
The Yield Map
Most property conversations in Kenya stop at the listing price. That's the wrong place to stop.
The ArdhiHome index tracks gross rental yield across 122 neighborhoods with sufficient sale and rental data. The spread is not subtle.
Nairobi's income-first neighborhoods. Wood Avenue leads the entire index at 24.9%. Riverside comes in at 24.2% with a KSh 9.9 million median sale price and KSh 200,000 median monthly rent. Kileleshwa — one of the most active sale markets in the city — yields 22.6%. Syokimau returns 21.9%. Ngong, 21.2%. Kilimani, the most liquid neighborhood in the country, yields 18.7%. Tatu City, still maturing, is already registering 17.9%.
These are not fringe neighborhoods. They are accessible — KSh 8–10 million entry points — and the rental demand is real.
Nairobi's capital appreciation plays. Muthaiga carries a KSh 200 million median sale price and yields 2.3%. Nairobi CBD, with a KSh 260 million median, yields 2.0%. Karen and Nyari both sit under 3.2%.
A sub-3% yield does not mean a bad investment. It means your bet is entirely on land value appreciation — a long-horizon, illiquid position that has historically rewarded patience in these particular neighborhoods. But you need to know that going in. A buyer who enters Karen expecting rental income is buying the wrong instrument.
The central insight from the data: Kenya's property market is not one market. It is many markets with fundamentally different risk/return profiles operating simultaneously — often within twenty minutes of each other. Conflating them produces expensive mistakes.
The Satellite Corridor
The satellite towns tell a story that premium Nairobi listings cannot.
Athi River has 673 active sale listings at a KSh 5.9 million median — the most active affordable market in the entire index, spanning apartments, townhouses, and land. Machakos offers a KSh 4.7 million median. Kitengela sits at KSh 9.95 million with 443 listings. Ongata Rongai carries 464 listings at KSh 10.5 million.
Then there's Ruiru and Kikuyu, both at a KSh 15 million median with 300–430 active listings each. The SGR infrastructure premium is already priced in. These are not "affordable" plays anymore — they are maturing markets that reflect what satellite towns become when the roads, rail, and services arrive.
For first-time buyers, diaspora investors seeking entry-level Kenya exposure, and income-seeking landlords who need accessible acquisition prices, the corridor from Athi River through Syokimau to Ruiru is the most compelling data story in the index.
The Coast
The Mombasa market divides sharply once you look at the numbers.
Nyali commands the highest coastal median in the index — KSh 28.5 million, with 530 active sale listings. That median is higher than every Nairobi neighborhood except Runda, Karen, Kiambu, and Muthaiga. Nyali is not a secondary market. It is a premium one, with the liquidity to match.
Diani sits at a KSh 22 million median. Nyali Area at KSh 21 million.
Then there is Mtwapa — 164 listings at a KSh 8.75 million median, with a gross rental yield of 24.7%. Third-highest in the entire index. For the coastal buy-to-let buyer, this is the most data-backed opportunity on the coast. Mtwapa is not glamorous. The numbers are.
The Capital Is Already Here
In 2025, Kenyan diaspora remittances reached USD 5.04 billion — crossing the $5 billion threshold for the first time in history, per Central Bank of Kenya (CBK) data. That is a 1.9% increase over 2024's USD 4.95 billion. North America accounts for approximately 60% of all formal remittance inflows, with the US contributing between 50–55% of monthly totals.
The CBK now projects 2026 to reach USD 5.24 billion, driven by recovery in Saudi Arabia inflows and continued growth from Australian and European corridors.
That capital has to land somewhere. For a significant and growing share of it, the answer is Kenyan real estate.
The System That Meets It
In May 2025, the presiding judge of Kenya's Environment and Land Court stated publicly that over 80% of land fraud cases handled in his court are perpetuated by officials within the Ministry of Lands itself.
Read that again. The people inside the system designed to protect title integrity are the primary fraud vector.
Kenya's property market operates with no publicly accessible comparable market analysis — no verified price baseline, no public agent registry, no transaction workflow that buyers can depend on. This opacity enables price manipulation, creates structural conditions for fraud, and leaves diaspora buyers — who have the most capital and the least ability to verify anything in person — maximally exposed.
This is the gap between USD 5 billion in annual remittance inflows and the market that receives them.
The Structural Case for Buying Now
Real estate contributed KSh 1.43 trillion to Kenya's GDP in 2025 — 8.2% of total national output — growing 3.9% in real terms, per KNBS data published in May 2026. In Q3 2025 alone, the sector expanded 5.7% year-on-year.
Kenya needs 200,000 new housing units per year. Approximately 50,000 are being built. The accumulated deficit now exceeds 2 million units. Urbanization is running at 4.3–4.4% annually — more than double the global average — concentrating demand in Nairobi, Mombasa, and their satellite corridors.
The structural demand is not a projection. It is already here, already underserved, and already growing.
Three Things Serious Buyers Should Take From This
Define your thesis before you look at a listing. Income buyers belong in Kileleshwa, Riverside, Syokimau, or Mtwapa. Capital appreciation buyers belong in Karen or Muthaiga. These are not interchangeable options — they are different financial instruments with different time horizons, liquidity profiles, and return expectations. The yield data makes this visible. Most buyers never see it.
The satellite corridor is underpriced relative to its trajectory. Urbanization at 4.3% annually and a 200,000-unit annual supply deficit mean the Athi River–Syokimau–Ruiru corridor will absorb demand that premium Nairobi simply cannot serve. Entry prices today will not hold for long.
Verification is not a step. It is the transaction. The presiding judge of the Environment and Land Court said it plainly in 2025 — the fraud is coming from inside the system. Every buyer, local or diaspora, should confirm their agent's EARB registration, request title documentation before any deposit is paid, and engage a qualified conveyancing lawyer. These are not formalities. They are the difference between owning land and learning an expensive lesson.
The ArdhiHome Kenya Property Market Index tracks 549 neighborhood-level data points across Nairobi Metro, Mombasa Coast, and Satellite Towns. Gross rental yield is calculated as (Median Monthly Rent × 12) ÷ Median Sale Price. All price figures are medians to reduce outlier distortion. Macro data from the Central Bank of Kenya and KNBS.
ArdhiHome is Kenya's trust-first real estate platform — verified agents, enforced listing standards, and the data infrastructure buyers need to transact with confidence.
"Buy. Sell. Build. With Confidence." | ardhihome.com
Kuya Machanja | Founder & Managing Director [kuyamac@ardhihome.com](mailto:kuyamac@ardhihome.com)| +1 (614) 806-1717